# Investment Portfolio Simulator
A modern web application for simulating and tracking investment portfolios with real-time data. Built with React, TypeScript, and Tailwind CSS.
Why this Project?
- I wanted to see how my portfolio would perform if I had invested in something else, and thus with savings plan(s)
- The main issue with other saving-plan calculators is, that they calculate based on the p.a. performance, i wanted further insights however, and thus this projected was created.
- It allows you to see how single-investments and savings plans would have performed, and how they would have affected your portfolio.
- There are multiple indicators and design choices made:
- TTWOR (Time Travel Without Risk) calculations
- Average Portfolio Performance
- Portfolio Performance & Value
- All assets (except the TTWOR and Portfolio-Value) are scaled by percentage of their price. Thus their referenced, scale is on the right. The referenced scale on the left is only for the portfolio-value
https://github.com/user-attachments/assets/78b027fa-9883-4813-8086-8b6aa19767de
## Features
- 📈 Real-time stock data from Yahoo Finance
- 💰 Track multiple assets and investments
- 📊 Interactive charts with performance visualization
- 🌓 Dark/Light mode support
- 📱 Responsive design
- *Mobile friendly*
- 📅 Historical data analysis
- *The portfolio is fully based on real-historical data, with configurable timeranges*
- 💹 TTWOR (Time Travel Without Risk) calculations
- *Including metrics for TTWOR*
- 🔄 Support for one-time and periodic investments
- *You can config your dream-portfolio by one time and periodic investments easily*
- 📊 Detailed performance metrics
- *See all needed performance metrics in one place*
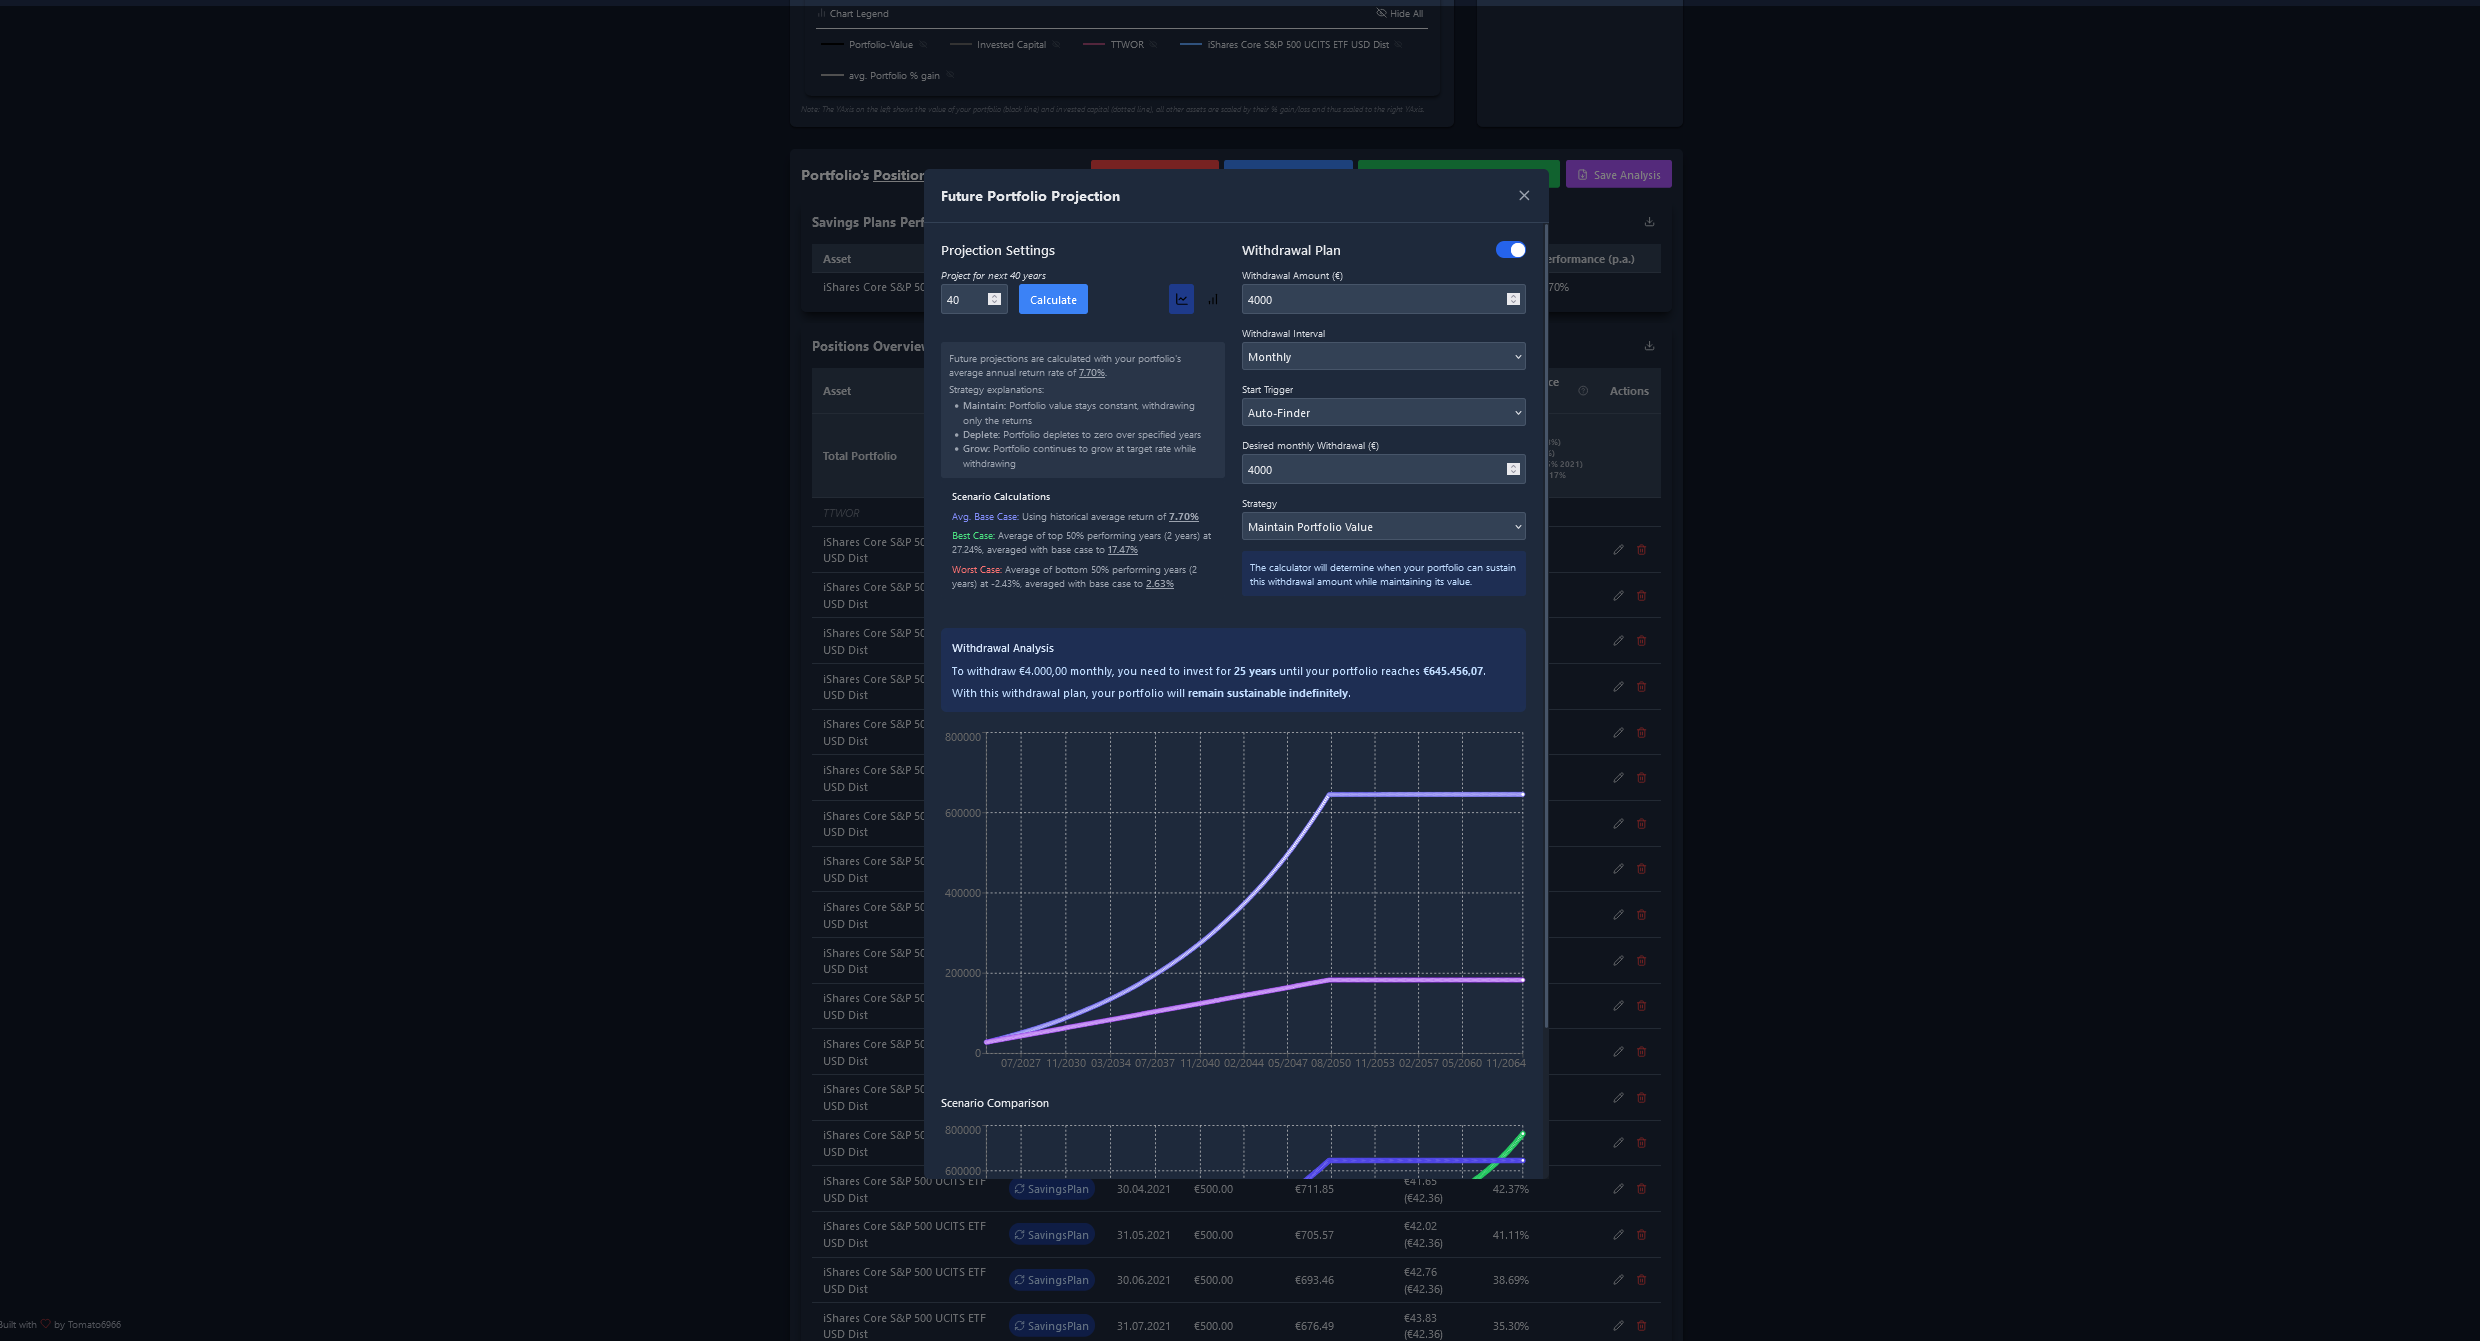
- 📅 Future Projection with Withdrawal Analysis and Sustainability Analysis
- *Generate a future projection based on the current portfolio performance, with a withdrawal analysis and sustainability analysis + calculator*
- *Including with best, worst and average case scenarios*
- 📊 Savings Plan Performance Overview Tables
- *See the performance of your savings plans if you have multiple assets to compare them*
- 📄 Export to PDF
- *Export the entire portfolio Overview to a PDF, including Future Projections of 10, 15, 20, 30 and 40 years*
- 📄 Export to CSV Tables
- *Export all available tables to CSV*
## Tech Stack
- React 19
- TypeScript
- Tailwind CSS
- Vite@6
- Recharts
- date-fns
- Lucide Icons
## Self Hosting
### Prerequisites
- Node.js & npm 20 or higher
### Local Development
1. Clone the repository
2. Run `npm install`
3. Run `npm run dev` -> developer preview
- Run `npm run build` -> build for production (dist folder) (you can then launch it with dockerfile or with a static file server like nginx)
- Run `npm run preview` -> preview the production build (dist folder)


### Credits:
> Thanks to [yahoofinance](https://finance.yahoo.com/) for the stock data.